


Accurate information in real time
Observability
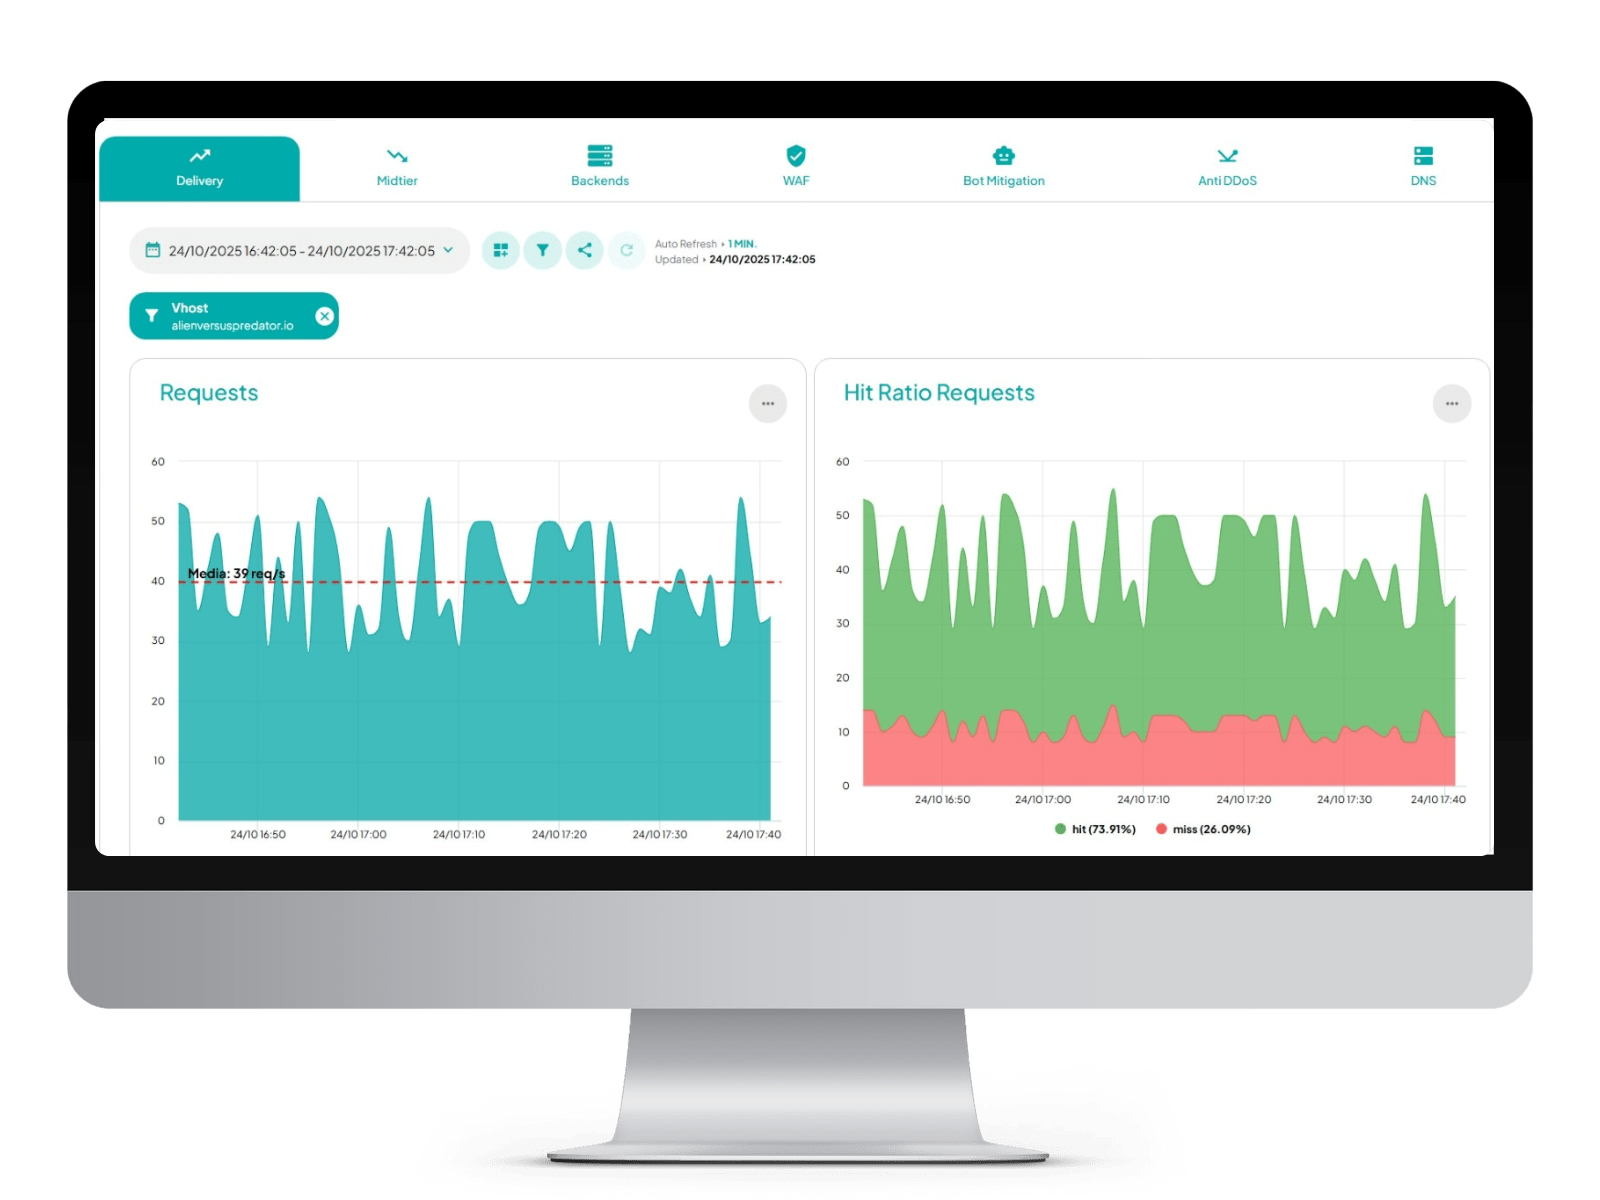
Our platform offers a comprehensive view of the behavior of your websites and web applications. It centralizes metrics and events in a single, real-time dashboard, providing the level of detail your technical teams need to act decisively.
Interpret traffic patterns, identify performance variations, anticipate attack attempts, and make informed decisions.


Real-time visibility
Having all the data in a single panel allows for a global or granular view without depending on external tools.
Total control
From latency variations to unexpected traffic spikes, the dashboard displays accurate information to anticipate risks and make quick decisions.
Dashboard
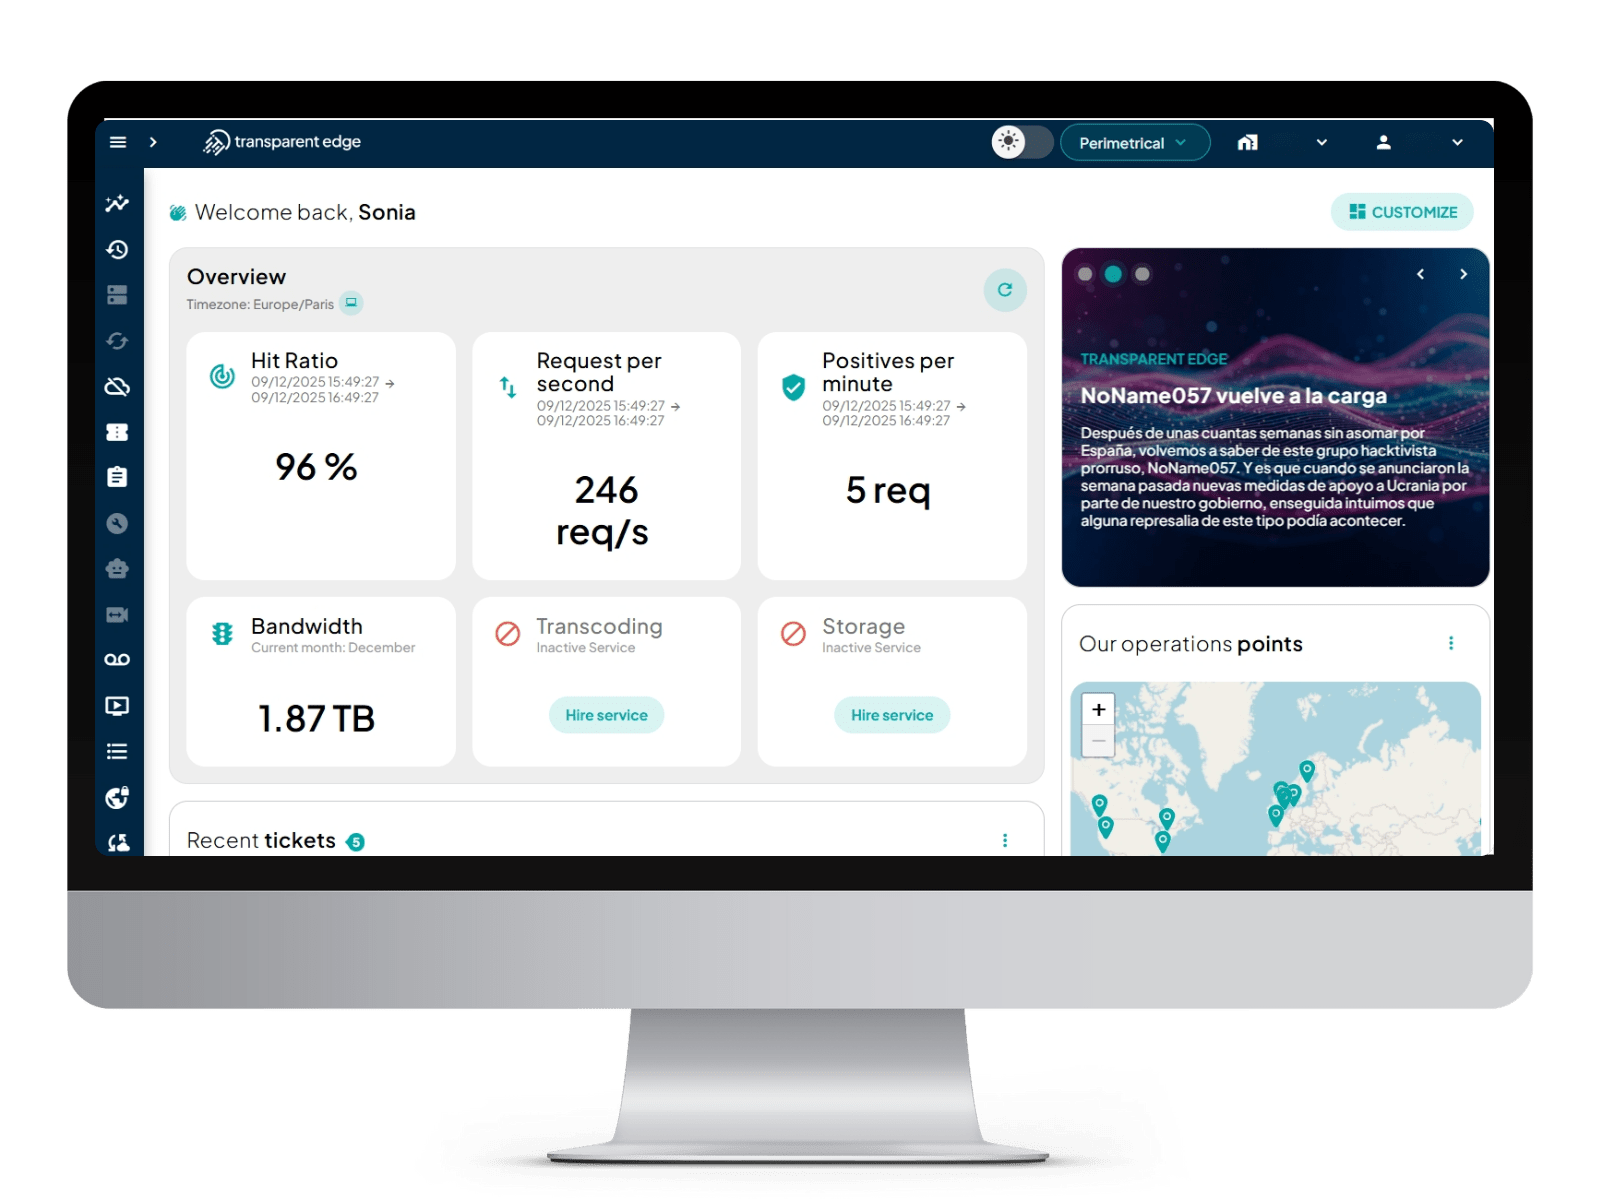
From a single dashboard, you get a complete overview of your metrics. The dashboard displays what’s happening in real time, visually and directly. You don’t need hours of analysis or complex configurations. You can also consult historical data to better understand usage patterns, identify bottlenecks, and develop contingency plans tailored to your business’s specific needs.
Key features
Advanced analytics and data retention
The data isn’t limited to the present moment. You can explore historical data, review trends, and detect patterns that anticipate potential risks. This strengthens the platform’s resilience and improves its responsiveness.
Operational control in a single interface
Decide what to cache, when to activate detection modes, or what to mitigate based on a clear understanding of the traffic state. Observability provides context to adjust the configuration according to what is happening at that moment.
Control panel always available
The dashboard operates independently of external services. This ensures stability and constant access for technical teams, even during high-demand scenarios or contingency situations.
Agile and actionable diagnosis
Advanced analytics makes it easier to pinpoint the cause of an issue. Metrics are updated in real time so you can see how the service is performing at any given moment.
The data isn’t limited to the present moment. You can explore historical data, review trends, and detect patterns that anticipate potential risks. This strengthens the platform’s resilience and improves its responsiveness.
Decide what to cache, when to activate detection modes, or what to mitigate based on a clear understanding of the traffic state. Observability provides context to adjust the configuration according to what is happening at that moment.
The dashboard operates independently of external services. This ensures stability and constant access for technical teams, even during high-demand scenarios or contingency situations.
Advanced analytics makes it easier to pinpoint the cause of an issue. Metrics are updated in real time so you can see how the service is performing at any given moment.

Depth of analysis
It allows you to explore data from a global view down to a detailed level to locate the cause of anomalous behavior.

Performance optimization
Identify load peaks, bottlenecks, and underutilized resources to adjust configurations and improve response times.

Data-driven strategy
Set up alerts and notifications based on your specific business needs. Accurate data is essential for control, and with our tool, you have the flexibility to configure everything to your specifications.
Optimize your dashboard
You can easily customize your dashboard views and visualizations, adapting them to your team’s specific use cases.
Make informed decisions, contact us for a demo.